
Safety Stock and Reorder Point Calculator
Safety stock is the extra inventory you keep on hand to protect against unexpected spikes in demand or delays in supplier delivery.
Reorder Point is the inventory level at which you should place a new order. The formula is: Reorder Point = (Average Daily Demand × Average Lead Time) + Safety Stock
Together, these two numbers help you maintain the right inventory levels… avoiding stockouts while preventing excess stock that ties up cash.
Two Calculation Methods
We’ve provided two different methods in the single calculator below so you can choose the one that best fits your data:
Simple (Maximum vs Average) Method
Best for beginners or when you have limited historical data. This method is conservative, so it will recommend higher levels of safety stock than the statistical method.
This method uses the formula Safety Stock = (Maximum Daily Demand × Maximum Lead Time) − (Average Daily Demand × Average Lead Time)
Statistical (Service Level) Method
Best for businesses with sales history who want a more precise, data-driven result.
This method uses the formula: Safety Stock = Z × Standard Deviation of Daily Demand × √Lead Time
How to Choose A Safety Stock Calculation Method
Use the Simple Method if you’re just starting out or prefer a quick, cautious estimate.
Use the Statistical Method once you have enough sales data for better accuracy and lower holding costs.
Expert Tip: Many businesses begin with the Simple method and switch to Statistical as they grow. You can run both and use the results as a helpful range.
Scroll down to use the combined Safety Stock & Reorder Point Calculator. If you need help interpreting the results, calculating standard deviation, or applying these numbers to your products, feel free to reach out!
Safety Stock & Reorder Point Calculator
Choose your preferred method below:
1. Simple (Maximum vs Average) Method
2. Statistical (Service Level) Method
Formula: Safety Stock = Z × σ × √Lead Time
Order new stock when your inventory drops to the Reorder Point.
Featured Products

Struggling with inaccurate inventory data? You're not alone… and it's costing more than you think.
How to Clean Bad Inventory Data: A Practical Guide to Restoring Inventory Accuracy offers a structured, hands-on approach to identifying, correcting, and preventing inventory data issues that lead to stockouts, excess, and lost revenue.
This 25-page guide includes:
Step-by-step audit and cleanup processes
Naming and coding standardization
Error identification tools and checklists
Proven strategies to prevent minimize data issues
Guidance on setting up long-term inventory governance
Whether you're a warehouse manager, supply chain analyst, or business owner, this book gives you the tools to restore data integrity and build a foundation for better forecasting, automation, and profitability.
📘 Available now — because clean data isn’t a luxury, it’s a requirement.
Table of Contents
Chapter 1: The Hidden Cost of Bad Inventory Data
Why Clean Inventory Data Matters
The Real-World Impacts of Bad Inventory Data
Objective of This eBook
Who This eBook Is For
What’s Next?
Chapter 2: Inventory Data Audit
How to Run a Physical Count (Cycle Counts vs. Full Counts)
Comparing System Data with Physical Data
Identifying High-Error Categories (e.g., Specific SKUs, Bins, Categories or Teams)
Checklist
Next Steps
Chapter 3: Standardizing Inventory Data
Naming Conventions for SKUs
Standard Units of Measure (UoM)
Location Codes and Labeling Consistency
Checklist
Next Steps
Chapter 4: Fixing and Removing Bad Data
Merging Duplicate SKUs
Correcting Quantity Errors
Archiving or Deactivating Obsolete or Inactive Items
Correcting Bills of Materials (BoMs)
Managing Adjustments Without Corrupting Financial Records
Checklist
Next Steps
Chapter 5: Preventing Future Data Problems
Role-Based Access to Inventory Changes
Training for Inventory and Warehouse Staff
Implementing System Controls (Mandatory Fields, Validation Rules)
Use of Barcode Scanning and Automation
Checklist
Next Steps
Chapter 6: Ongoing Maintenance and Governance
Cycle Counting Program Setup
Monthly Data Integrity Checks
Inventory KPIs to Monitor Accuracy
Who Is Responsible for Ongoing Data Health
Checklist
Next Steps
Conclusion
Recap of Actions Taken
Summary of Benefits from Data Cleaning
Next Steps: Automation, ERP Upgrades, Better Forecasting
Full Cleaning Checklist (Summary Version)
Prefer to buy the print edition from AMAZON? no problem. Click here.

Download this convenient checklist to use with your own SKU system. File format is PDF for easy printing.

Optimize your inventory management with our Excel template! Calculate safety stock and reorder points, ensuring efficient stock levels and minimizing stockouts. Streamline your operations today!
This template also assesses supplier's lead times (actual lead times not verbally contracted lead times).
Includes Excel files and video instructions. The instructions will link you to two free videos on YouTube which show you how to use the templates.
Video 1: https://youtu.be/A3GxkloruLE
Video 2: https://youtu.be/XCe11NVhv_M

10:00 AM (Eastern Time)
Forecasting sales is crucial for businesses as it provides a roadmap for planning and decision-making.
If you’re a seasonal business, forecasting becomes even more important since your risk of going out-of-stock or over-ordering is higher. Join me in this casual meeting as we discuss how to do seasonal forecasting in Power BI and Excel.
What we’ll discuss
What is a seasonal forecast? What does it mean to decompose a seasonal forecast?
How to use the built-in forecasting tool inside Power BI and where it fails us.
How to code your own seasonal forecast for every product you offer.
How to use AI for seasonal forecasting.
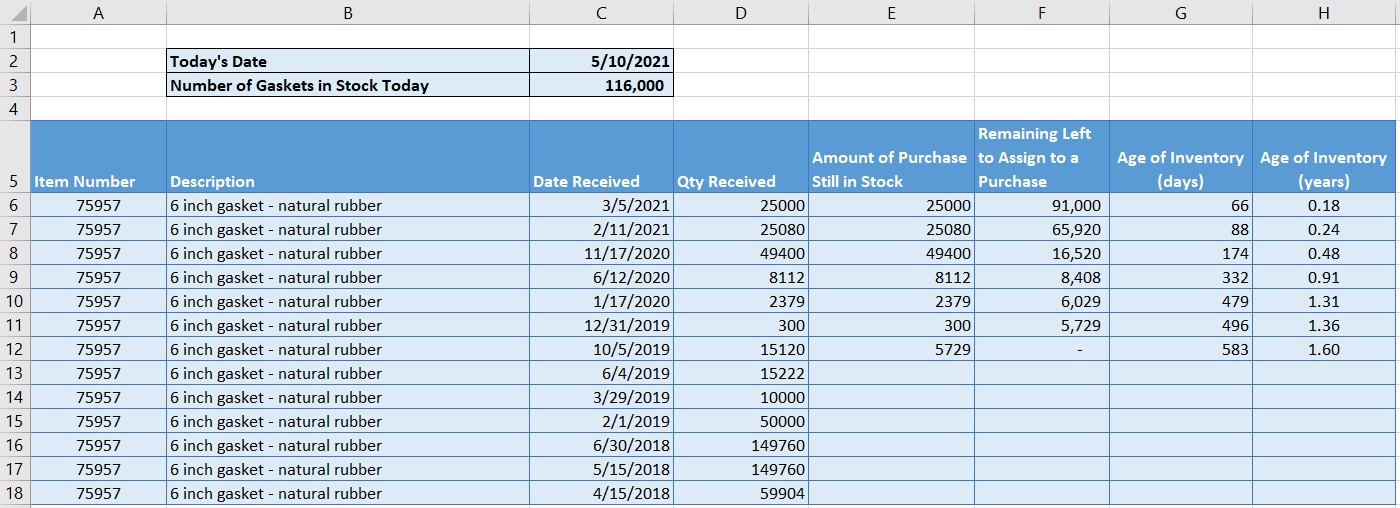
A template to help you calculate the age of your inventory based on FIFO (first-in-first-out) purchases.
You can view this template in the following YouTube video: https://youtu.be/FteITiZn45E

Download this template to conduct an ABC analysis on your own inventory to see which items should be prioritized and managed more closely than others. A demonstration of this template can be found in the following YouTube video: https://youtu.be/C-ed_CbGz3Q

Calculating inventory turns for individual SKUs tells you which items are selling quickly and even more importantly, which ones are selling slowly! This is a vital inventory metric when it comes to making business decisions about which items to keep selling and which ones to stop selling.
If you’re a small business and don’t have the luxury of an inventory management system or ERP system, then this Excel template may be useful for you when it comes to assessing the performance of items you sell.
To view a demonstration of this template and how to use it, click here to see the YouTube demonstration video.

Find profit leaks in the items you sell by calculating the gross margin % for each item. Optionally, you can also calculate the gross margin % for each of your sales channels.
This template will calculate gross margins based on sales and cost of goods sold. It will highlight profit leaks in red.
You can click here to read the following short article to see an example of analyzing profit leaks for a multi-SKU company.
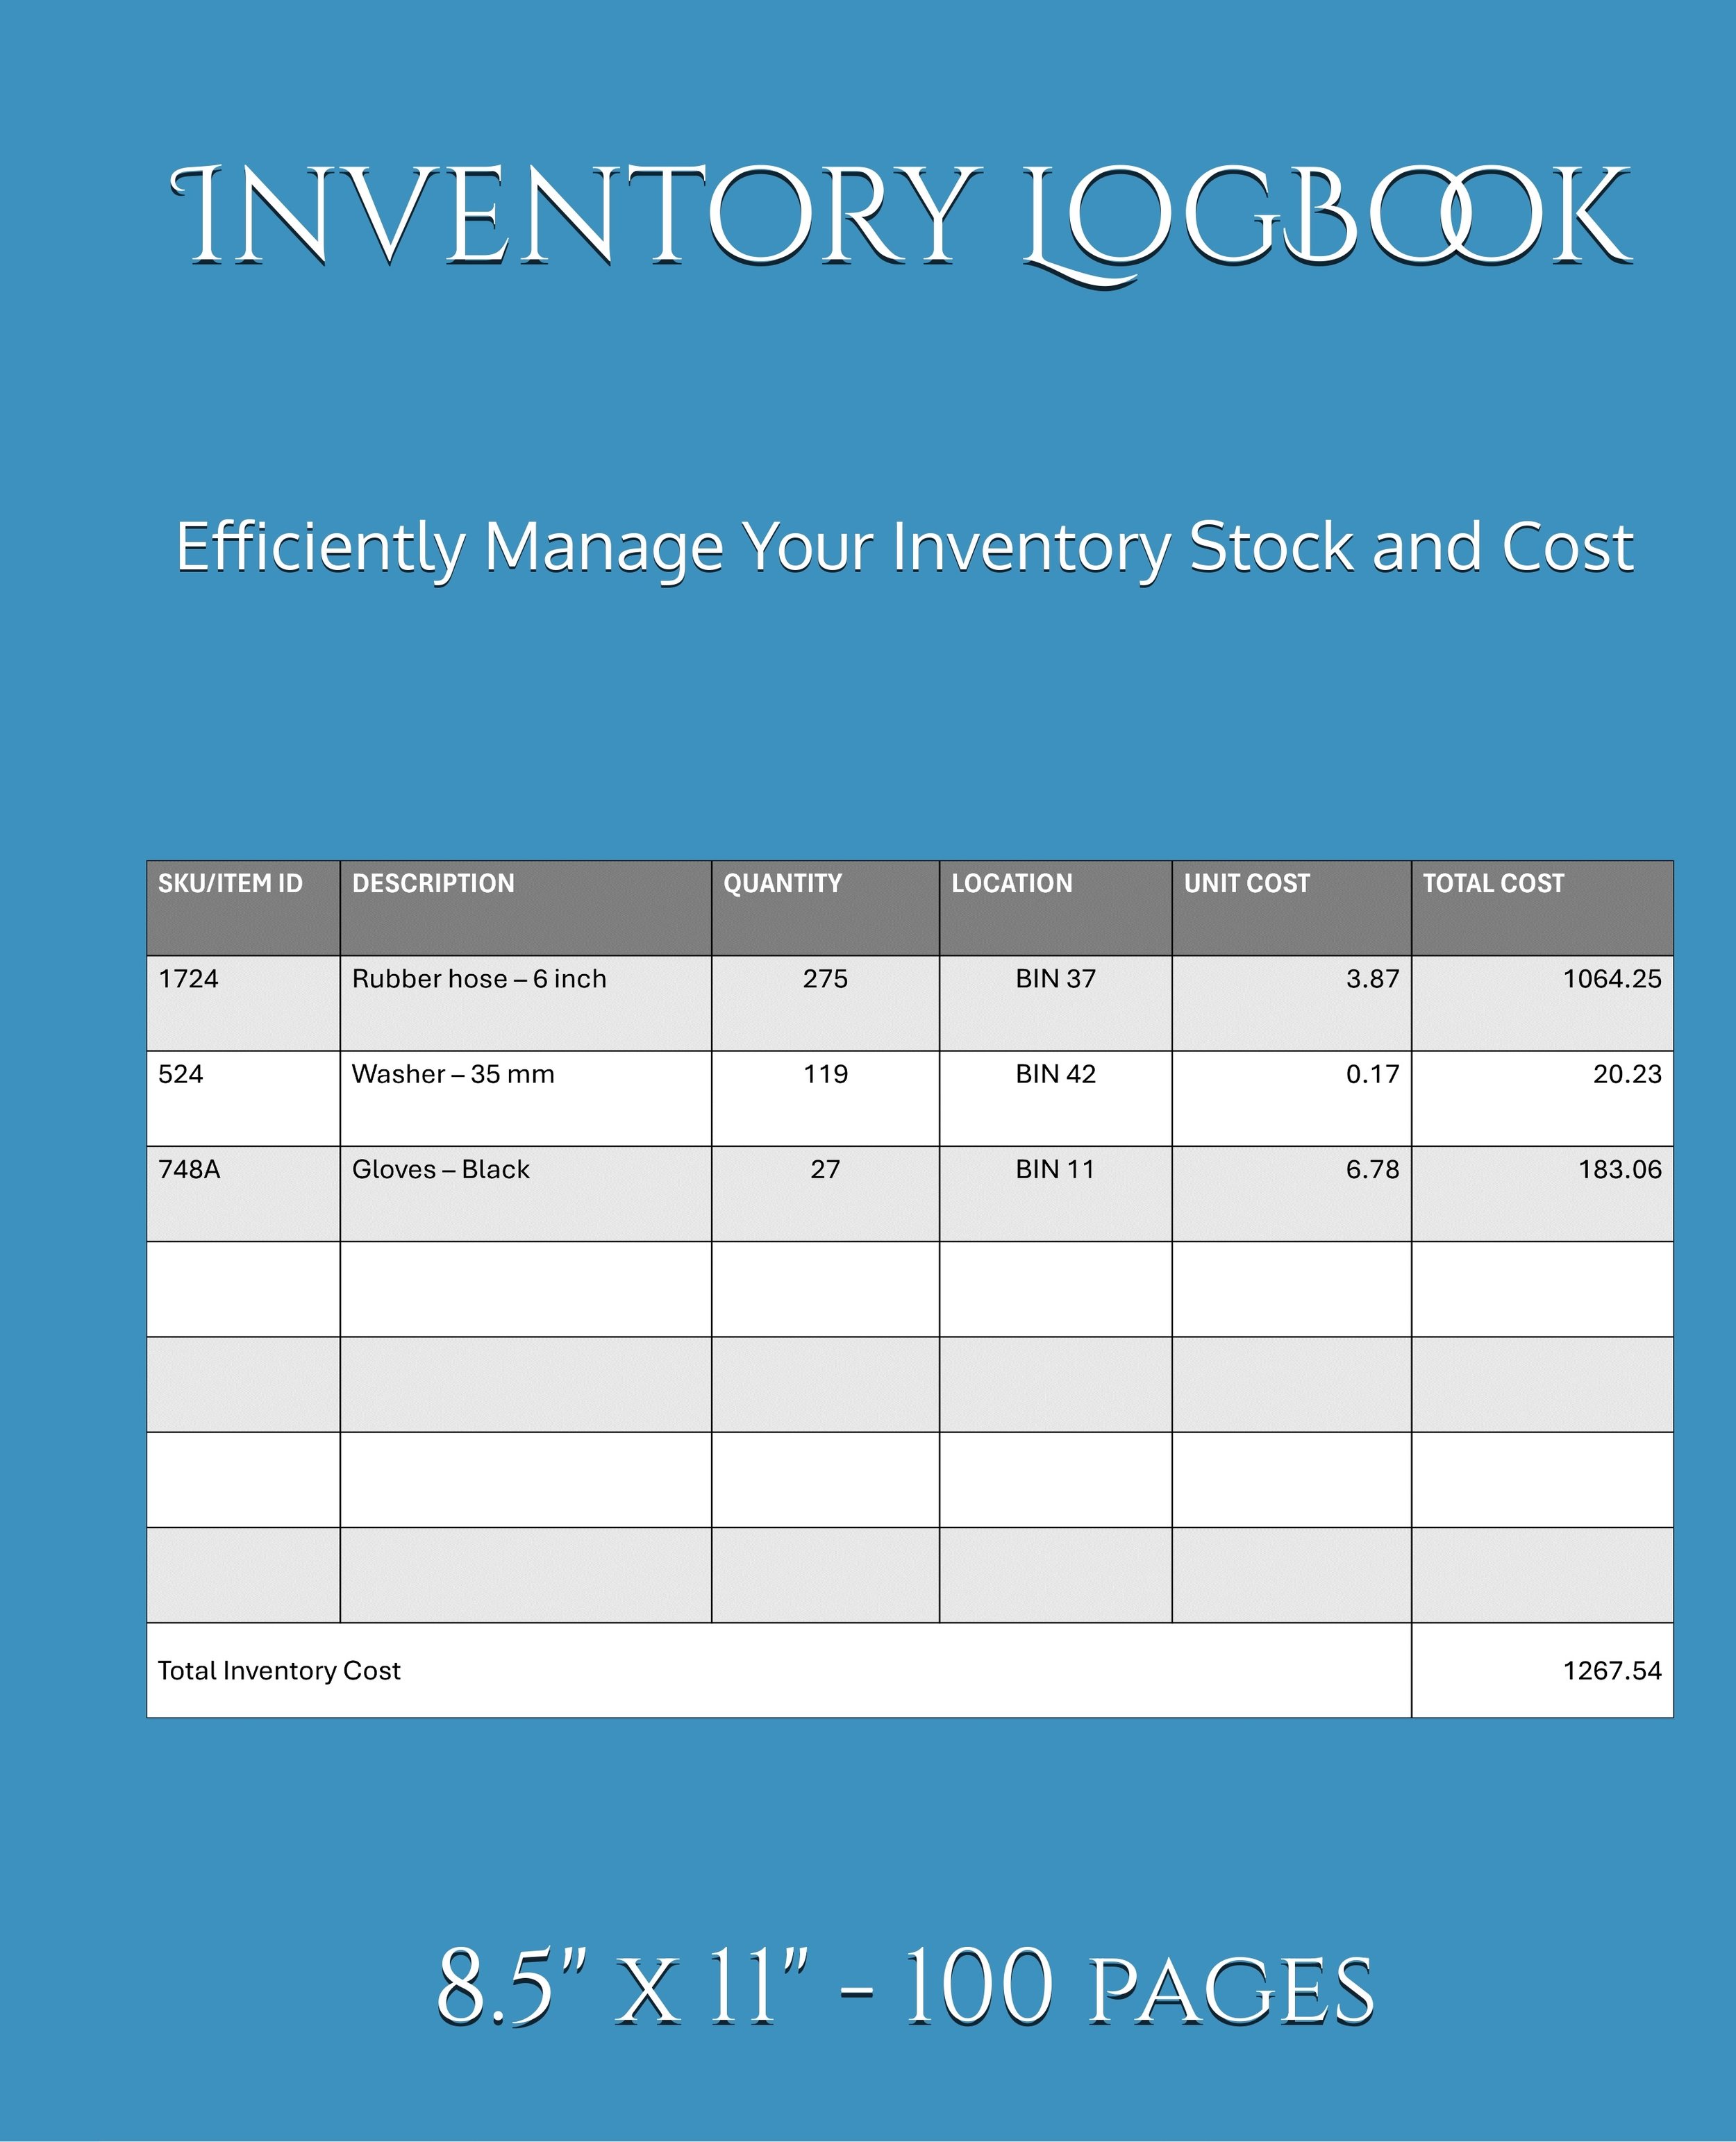
Introducing an inventory logbook built by a Certified Supply Management expert. This logbook is designed to bring simplicity to your inventory management so you can accurately track the stock of each item. Dedicated to all the small businesses out there that don't have the luxury of scanners and bar codes. Order Your Inventory Logbook Today and Experience the Calm of Simplicity!
Great for small business owners or entrepreneurs who need simple inventory tracking.
Also tracks your Cost of Inventory (COI) since COI impacts your cash flow.
Flexibility: Use one page per SKU or record multiple SKUs on a page.
Instruction sheet included inside the eBook
Dimensions: 8.5" x 11" - easy attaches to a clipboard
Pages: 100 (or print as many pages as you need)
Made in the USA (if you purchase the paper version from Amazon)
This ready-to-use digital toolkit empowers supply chain, inventory, and procurement teams to instantly analyze purchase order (PO) receipt performance against contract lead times.
You can view a demonstration video on YouTube: https://youtu.be/kuUoTIiebBs
What’s Included:
Professional Excel Template (PO_Receipts_Input_Template.xlsx)
Clean, structured data entry sheet with built-in date formatting
Comprehensive Instructions sheet with column explanations
Sample data for quick onboarding
Designed for easy copy-paste into AI tools or direct analysis
Powerful AI Analysis Prompt (copy-paste ready)
Delivers a complete professional-grade report
Covers: Overall Performance Summary, Detailed Lead Time Calculations, Supplier Performance Table, SKU Insights, Risk & Inventory Impact, and Actionable Recommendations
Written by a supply chain analyst with 30+ years of experience
Key Benefits
Save many hours per analysis… Go from raw PO data to executive-ready insights in minutes
Identify unreliable suppliers and SKUs instantly with data-driven variance analysis
Reduce stockouts by setting accurate ERP lead times and safety stock buffers
Improve supplier negotiations with clear performance data and recommended contract terms
Professional, consistent reporting… perfect for monthly reviews or leadership presentations
No coding or complex formulas required
Who This Is For
Supply Chain Analysts
Inventory Managers
Procurement & Purchasing Teams
Operations Directors
Small-to-Medium Manufacturers & Distributors
Perfect For
Monthly supplier scorecards
ERP lead time updates
Inventory optimization projects
Risk reduction initiatives
Preparing for supplier business reviews
Format: Digital download (Excel .xlsx + Word/PDF prompt document) Instant Delivery: After purchase, you’ll be able to download these files immediately via email or download link.
License: Personal & Business Use (one company). Unlimited internal analyses.