We Make Managing Inventory Easier
For many companies, the information you need to make crucial inventory decisions is buried in multiple reports and not easily accessible. We help medium-sized businesses get the right information in front of those who need it for decision making. Our dashboards are built and stored securely online using Microsoft tools.
We offer two categories of inventory dashboards:
A Shopify-specific dashboard based on standard reports exported from Shopify.
Customized dashboards designed to work with your specific ERP system.
Shopify Dashboards
Elevate your Shopify business with our Power BI dashboard designed specifically for Shopify entrepreneurs. Our solution is built on standardized Shopify reports, offering you a powerful tool to gain deeper insights into your sales and inventory performance. Our dashboard provides visualizations that empower you to make data-driven decisions, optimize your operations, and increase your profitability.
Our Power BI dashboard transforms your Shopify data into actionable insights, helping you better optimize your inventory. By leveraging standardized reports, you can quickly identify opportunities for growth, streamline inventory management —all while saving time on manual data analysis.
Designed for ease of use, our dashboard requires no technical expertise, making it perfect for busy entrepreneurs who need clear, concise, and reliable data at their fingertips. Whether you're looking to scale your business or simply gain more control over your operations, our Power BI dashboard is the tool you need to stay ahead in the competitive e-commerce landscape.
Get started today and transform your Shopify data into a strategic advantage. Contact us to learn how our Power BI dashboard can help you unlock the full potential of your Shopify store.
Customized Dashboards
Designed for how YOU and your team members need to work.
Unlock unparalleled insights and efficiency with our customized inventory management dashboards powered by Microsoft's Power BI. Designed with Microsoft’s top-tier security, these dashboards provide real-time visibility into your inventory, helping you optimize stock levels, reduce costs, and improve decision-making. Whether you're managing a small business or medium-sized business, our solutions put crucial data at your fingertips for easy decision-making.
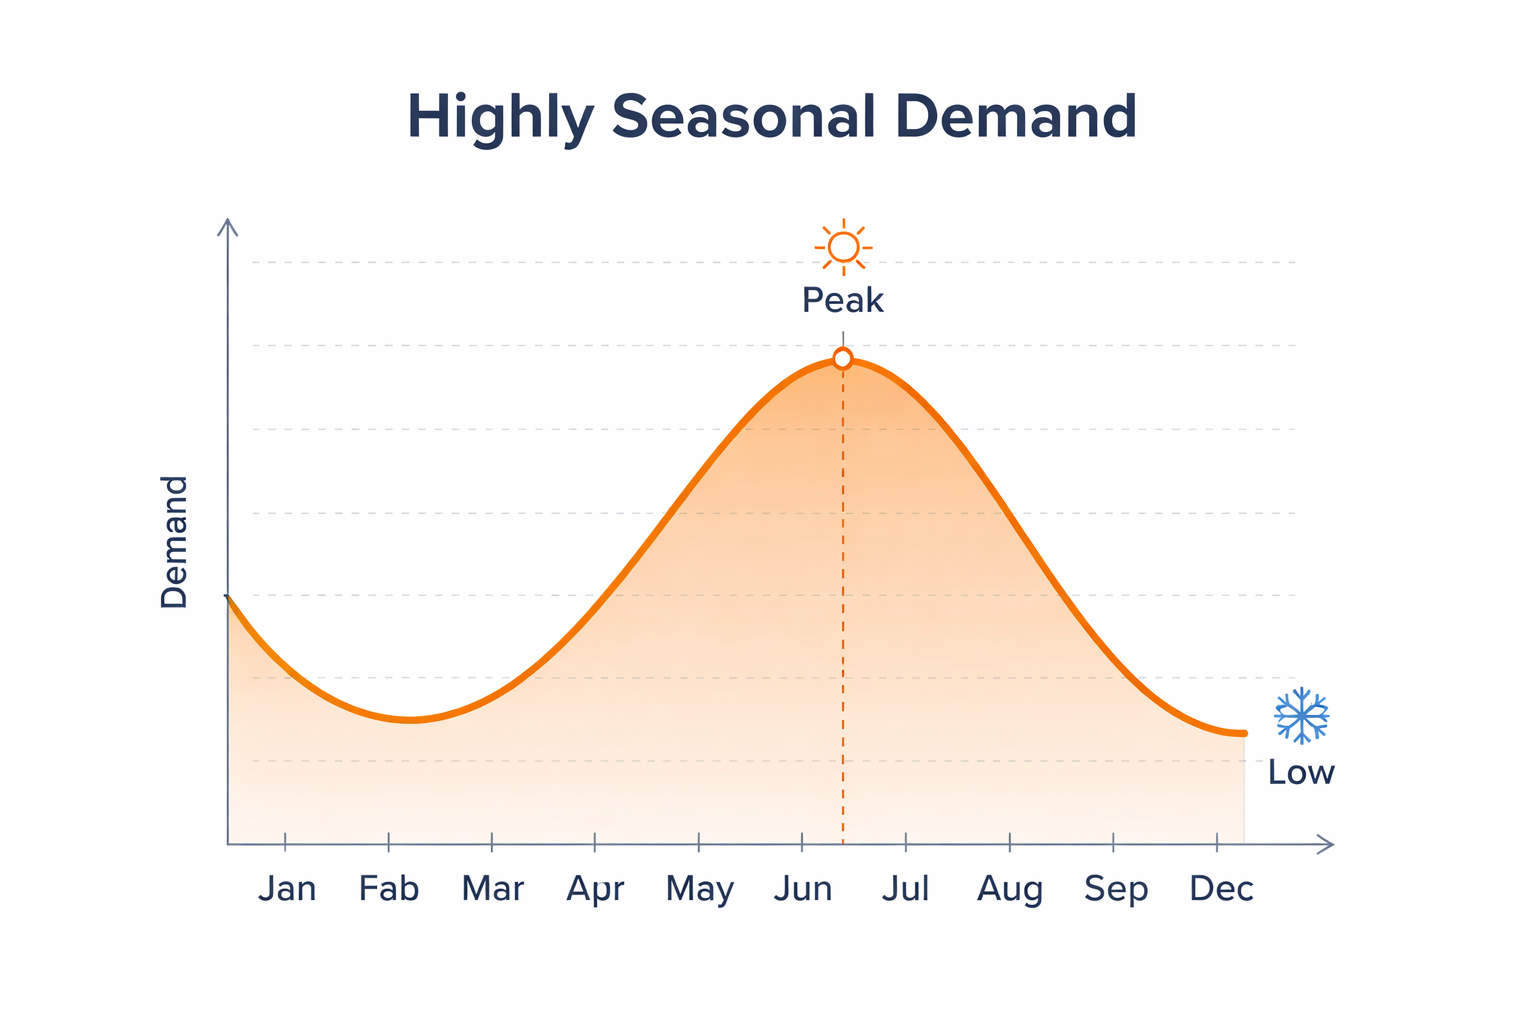
Harness the power of advanced analytics and interactive visualizations to monitor inventory trends, track performance metrics, and forecast demand with precision. With Microsoft's robust security features, you can trust that your sensitive business data is safeguarded against threats, giving you peace of mind as you scale your operations.
Elevate your inventory management processes today with our custom-built dashboards. Designed to meet the unique needs of your business, our Power BI solutions empower you to make data-driven decisions that drive growth and profitability. Contact us to learn more about how our secure, scalable inventory management dashboards can transform your business.
Explore our Sample Dashboard
Shown below is a sample inventory management dashboard that some of our clients use. You can explore all 4 pages by clicking on the arrow next to 1 of 4 shown below the chart. For a full screen view, click the double-headed arrow symbol in the bottom-right corner.
Page 1: A summary of all finished goods
The base unit of measure, on-hand, committed and available inventory.
The amount of product on order (internally or externally depending on your type of business).
The number of days of supply (DSI).
A 3-month and 6-month forecast of product demand.
Page 2: A Summary of Raw Materials
Based on the bill of materials for each finished good item, the raw material needs are calculated.
The amount of raw materials on-hand, committed, available and on order.
The number of days of supply (DSI).
A 3-month and 6-month forecast of product demand.
Page 3: The Cost of Inventory
Displays the amount of cash flow tied up in inventory for both finished goods and raw materials.
Page 4: Negative Inventory Counts
Sometimes inventory counts go astray and many companies experience negative inventory counts in their data systems. This page indicates items that may need to be recounted to improve inventory accuracy.
Why Use an Inventory Management Dashboard Tool?
Spend less time managing your inventory
Free up valuable time previously spent searching data from multiple places or performing manual updates.View all of your inventory information in one place to see the entire picture
Whether you sell on Amazon, Shopify or through retail distribution (JC Penney, Target, Wal-mart, Ulta, Walgreens, CVS), or any other website platform, view all of your inventory in one central portal from anywhere in the world.Eliminate the risk of missing sales or disappointing customers
With the ability to see inventory already committed to orders and the resulting inventory quantities that are truly available, you’ll know when you’re about to over-commit your supply.
Reduce the amount of cash flow tied up in inventory
While no-one can predict future product demand perfectly, the use of forecasting helps reduce over-production of goods that sit on the shelf tying up valuable cash flow.
Contact us today to learn more about our dashboard products and to receive an online demonstration.