
Analytics for Strategy… or Survival

As COVID-19 spread across the globe, the fragility of supply chains became obvious. Many countries quickly discovered that having most of your suppliers outside of your home country came with more risk than ever realized. As supply chain professionals, we have plans to mitigate the risk of localized disasters such as floods and earthquakes. However, no-one planned for a supply chain disruption that would impact virtually every country on the planet.
You have certainly heard the government briefings from multiple countries. The supply of medical products became strained as usage rapidly increased while shipments from outside of the country became delayed or appropriated for local needs.
As states of emergency were declared and stay-at-home orders obeyed, some companies declared analytics useless. For these companies, the primary goal was to keep the company operating. For several of my clients, the metrics and analytics that we had put in place in the last 6-12 months became the data tools by which they managed their business decisions during the pandemic closures. Here are their stories.
Multi-generation Haircare
My first story comes from a family business that has operated for over 30 years. The company provides several collections of haircare products and sells through major retailers and several online channels. Their revenue is in the range of $30-40 million.
The company’s CEO is a member of the family’s second generation. About 6 months ago, he recognized the need to embrace data analytics to improve decision-making and the speed thereof. He and his team were ready to learn how to leverage the use of data and have a greater and more detailed insight into business operations.
Building Customized Solutions
The company uses an ERP system that is somewhat dated and restricted in its capabilities, but it serves the daily tactical needs of the company. However, it doesn’t serve the more strategic needs.
We gained access to the SQL data that runs the ERP system and began to construct real-time, interactive dashboards. We could see the profit of each product, across each selling channel and for each customer. While the margins were quite healthy, we found opportunities to improve those margins when the detailed views became visible.
We provided visibility into the inventory stored in multiple locations, including third-party retail consignment warehouses. With this new-found transparency of data, it was easier to identify a surplus of some finished goods and to see where forecast values indicated a need to produce more.

Using the bill of materials, the demand of finished goods was mapped down to the raw material level. Combined with near real-time information on the amount of raw materials on hand, available and on order, inventory management professionals could make better decisions regarding raw material purchases from suppliers.

We studied the order patterns of each product and generated demand forecasts by which finished goods and raw materials could be planned. These forecasts were based on longer-term historical data for each product and the forecast allowed us to determine the number of days of supply that this company had in-house.
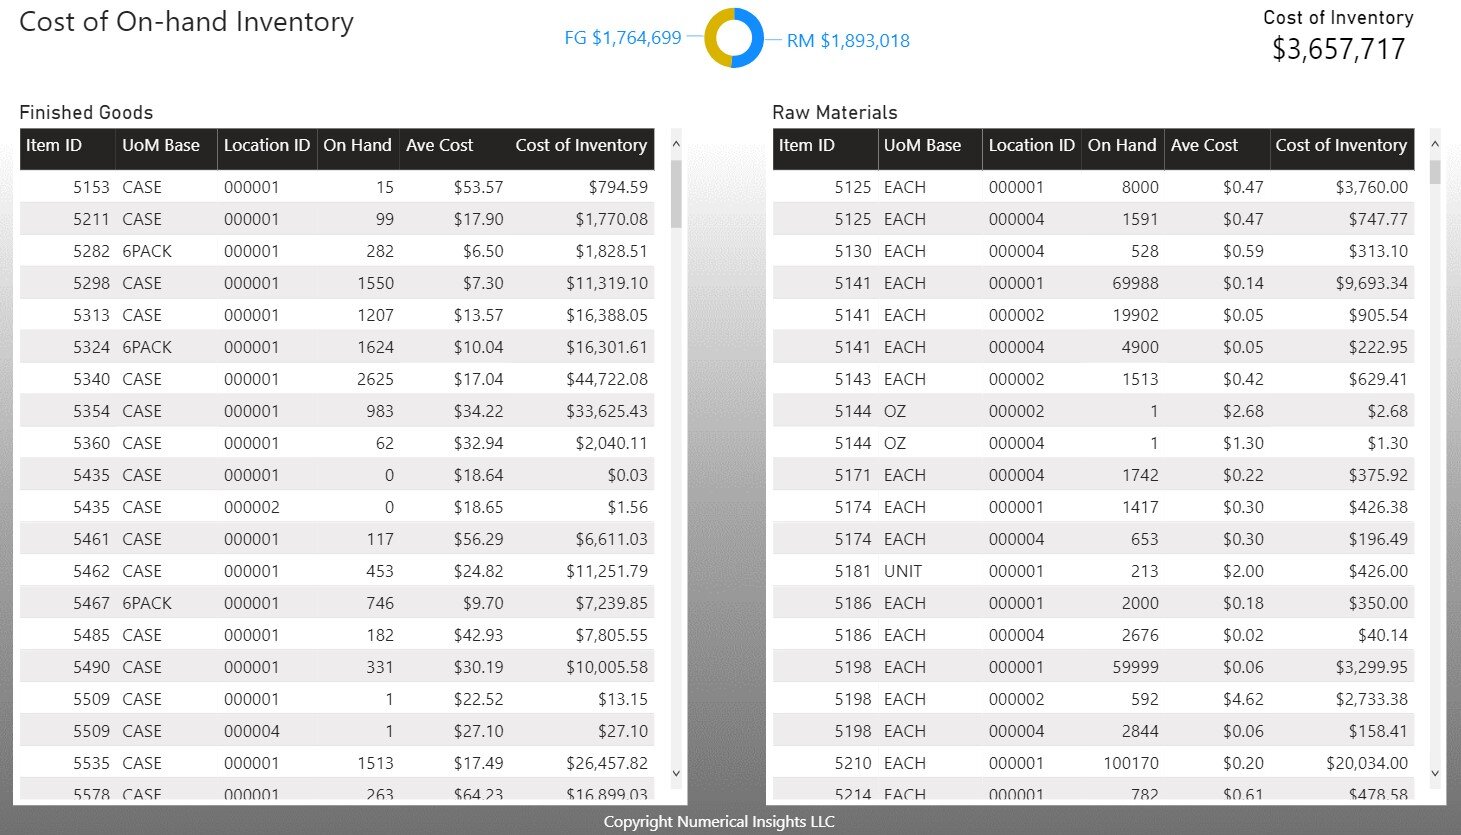
We provided visibility into the cost of inventory, i.e., how much precious cash was tied up in inventory that the company could not access for other purposes. This allowed inventory management professionals to see which items were in excess and which items have the greatest impact on the company’s cash flow.
Just as the team was becoming comfortable with their new set of tools, COVID-19 spread across the world. Economies ground to a halt. States of emergency were declared. Shelter-in-place orders were enacted.
A Shift from Long-term to Short-term
Most large retail chains halted their orders as consumers stayed at home. Online ordering became the new norm and this company experienced a complete shift in its dominant sales channels. Suddenly, the challenge became shifting inventory management to support online channels — channels which had previously been only 20% of the company’s sales.
In addition to shifting inventory management, company operations also needed to shift. Previously, inventory was primarily shipped to large retailers, so the company was set up to ship pallets of cases. Supporting online sales meant a substantial increase in products that are shipped as individual units. This was a shift that completely changed packaging needs and required moving manpower to different areas of production.
Using Data to Support the Shift
With the shifts required above, the previous forecast, which had been based on a two-year history of seasonal patterns, was no longer representative of the anticipated future. Using the existing data tools and dashboards previously developed, we switched to looking at daily trends rather than monthly trends.
The forecast of product volumes for roughly 150 products was generated based on recent (very recent!) ordering history. We reviewed and adjusted forecasts every few days until a “new normal” could be seen from the ordering data. After two weeks, we shifted our forecast review to weekly and could better manage the amount of inventory that needed to be sent to each selling channel.
The CEO admits that without having these analytical dashboards in place, he would not have had any insight into what to expect during the COVID-19 lockdown. Instead, we used these tools to adjust production expectations, reassign workers where they were needed and to quickly align expenses to expected revenue levels.
Multi-generation Beverages
My second story comes from another family business which has also operated for over 30 years. The company provides alcoholic beverages to restaurants, convenience stores and bars. For this company’s business model, all customers make their purchases in person and customers are licensed to purchase alcohol within their own state.
While the company in my first story had to manage inventory of both finished goods and raw materials, this second company is a distributor which means they resell finished goods. When we first met, this company struggled under the strain of restricted cash flow and turned to analytics to help them hurdle this issue.
We equipped the leadership team and employees with several analytical dashboards last year which gave them a clear picture of their profitability by product and customer. We armed them with a finished goods inventory dashboard and the capability to see the seasonality of each product category. Since this company was operating the same way today that it did 30 years ago, this initiative also required an educational component on how to use these dashboards for data-driven decision making.
When we first began working with this company, they were in need of improved cash flow. The customized tools we created allowed them to make key decisions about which products to keep, which to discontinue (after running down the inventory) and how to restructure their customer discount structure to improve cash flow. We provided a “what-if” tool to model several discount structures and to predict the increase in cash flow which could result from the multiple options. Several months into a path of improved cash flow, COVID-19 arrived.
Alcohol as an Essential Business
In many locations throughout the USA and Canada, the sale of alcohol was categorized as an essential service. I think that had more to do with who the recipients of the collected alcohol taxes were rather than the average person’s need to consume. Regardless, it was welcome news for this company and it meant they could continue to operate.
Unfortunately, since restaurants and bars were closed, a significant portion of their customer base was no longer coming in to place orders. The company worked quickly to serve remaining customers with masked employees spaced 6 feet apart at their order desk. Their warehouse was large, so maintaining a physical distance in the warehouse was easily accomplished.
Like the company from my first story, we helped the CEO of this liquor company understand what the most recent data was telling him about his family business. This allowed him to make decisions regarding weekly supplier orders, employee assignments and customer discounts.
A profit projection for the coming months, based on this data, determined whether he would need to apply for small business funding from the federal government to make it through the pandemic.
A dashboard showing the customer load in his building (how many customers were in his building each hour of each day) allowed him to project his employee needs. Since those needs were reduced, he leveraged those additional resources to make progress on two inventory projects that had stagnated due to a lack of resources: improving the accuracy of inventory counts with UPC codes and assigning dedicated locations for products in the warehouse.
For those reading this article who operate high-tech warehouses, remember that this is a family business that had not changed its business practices in many years. If you’ve ever tried to access a consolidated library of UPC codes, you’ll understand some of the challenges associated with their warehouse initiatives.
Creating Your Own Inventory and Business Analytics Tools
Having spent several decades applying analytics to engineering design problems, inventory management and human resource issues, I can safely say that many of the techniques that we use today have existed for a very long time. What has changed is that the tools used to perform analytics today have become much less complicated and the need to know the sophisticated mathematics behind them is not always a requirement.
For example, many years ago, I was handed a magazine article describing the least squares algorithm which is used for linear regression analysis. My task back then was to write computer code to perform a least squares analysis. Today, executing a linear regression analysis is the click of a button. Those that click that button today do not necessarily need to understand the code or mathematical concepts behind it.
Additionally, the cost of obtaining or accessing these tools has been substantially reduced. Some tools are even free. Even small businesses with a few employees can leverage do-it-yourself analytics tools.
Over the years, data storage has become inexpensive. The need to buy and maintain your own physical server to house your databases is no longer needed. Cloud storage makes it possible to easily access your data in a cost-effective way.
The ability to create your own customized tools and to empower your employees to use these tools for rapid decision-making is no longer out-of-reach for companies that are not part of the Fortune 500. Medium-sized businesses should no longer feel like they are at a disadvantage if they do not own expensive, enterprise-wide inventory management, MRP or ERP systems.
In Summary
It took decades for analytical tools to evolve. It took just a few days for COVID-19 to halt the world economy. While some companies threw analytics out of the window to prioritize keeping the company running, others relied on analytics for their very survival.
As the impact of the pandemic fades, many of its effects will be with us for years. For supply chain professionals, risk mitigation to deal with future pandemics is a must and analytics can be one key tool in your journey of mitigation.