
How to Measure Inventory Turnover / Inventory Turns
No time to read? Watch this 10-minute video explanation of inventory turnover instead.
Measuring how fast you sell through your inventory is a key measurement of inventory management performance. This metric goes by several names, so don’t worry if you hear multiple references. They’re all the same metric.
Inventory turns,
Inventory turnover,
Inventory turnover rate, and
Inventory turnover ratio.
I’m going to call it inventory turns throughout this explanation.
Learn about inventory management or take this course as a refresher on the basics.
What do we mean when we reference an inventory turn? What did we actually turn our inventory into? We sold it and turned it into revenue. So, the number of inventory turns tells us how many times we sold through our inventory in a given period of time.
Most companies measure inventory turns on an annual or quarterly basis. When I create real-time dashboards for clients, I also like to display inventory turns based on the last 365 days so clients can see if they’re improving their inventory management without having to wait for the end of the next quarter or end of the next year to find that out.
How do we calculate inventory turns?
Two formulas for inventory turns

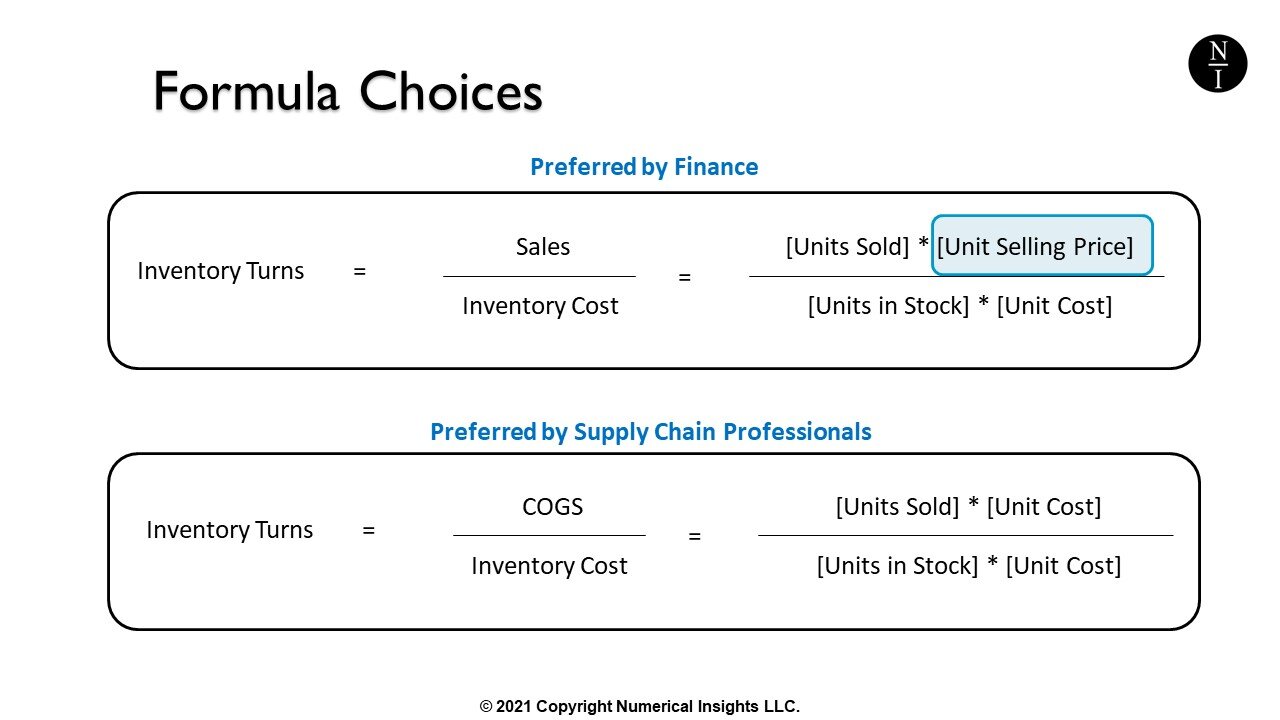
There are two formulas. In both cases, the values put into these formulas are in dollars, Euros, pounds or whatever the base currency is for your company.
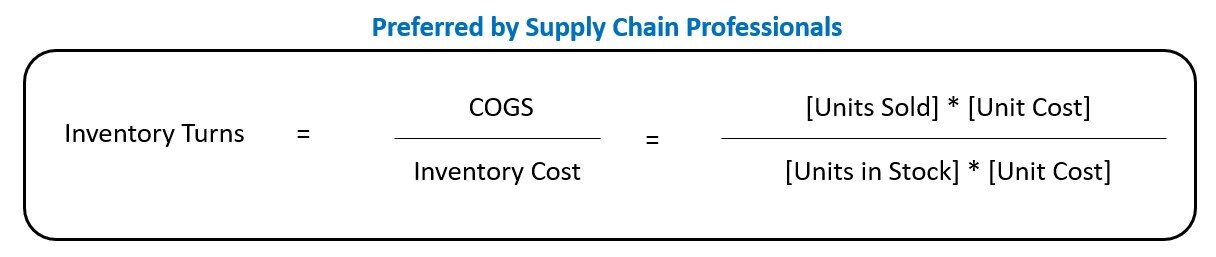
The difference between these two formulas is that the first one, since it contains sales, has a price component built in. The second formula does not relate in any way to price. The finance department tends to like the first formula, whereas supply chain professionals like the second formula.
Since supply chain professionals use this metric to measure how well they manage inventory, their interest lies in the speed at which product is shipped out to customers. That means their focus is on unit quantities and not selling price.
My focus is on helping clients with inventory and operational analytics, so I’m going use the second formula for the rest of this explanation. While the formula looks simple, there are a few important details you need to know about when determining the values for the cost of goods sold (COGS) and inventory for this formula.
What Goes into the Cost of Goods Sold Calculation for Inventory Turns?
Let’s start with the COGS. We can just pull this off the financial statements, right? When it comes to the most appropriate COGS value for the purpose of measuring the speed of inventory movement, it’s not that simple. I’ll show you why.

Suppose you go to your company accountant and ask them for details on the COGS calculation. They show you the values in the column called, “From Accounting.” This is a list of general ledger account numbers that are part of the company’s overall COGS which is reported on its financial statements.
You then extract sales records from your company database, including the cost of each sale. These records yield the costs listed in the column called, “From Product Sales.”
What’s the difference between these two representations of the COGS? Which one is better if we want to correctly interpret the speed at which our inventory sells and even more importantly, correctly interpret changes in the speed at which our inventory sells?
The difference between these two sets of numbers is that information from the accounting records includes additional general ledger categories that are highlighted in yellow. These categories are not linked to specific sales transactions.
Looking at the descriptions of the highlighted general ledger codes, we can see that many of them are adjustments to the value of inventory for a variety of reasons. We can also see what we paid for inbound freight and what we paid for labour, i.e., the wages for personnel creating our finished goods inventory.
This is where we need to use logic to make a decision.
We are measuring the speed of selling inventory. If the company made adjustments to the value of inventory, those adjustments are in no way related to measuring selling speed, so I would not include those in the COGS value when calculating inventory turns.
The cost of freight in and labour does relate to the speed of selling inventory since the more we sell, the more labour we need to keep producing inventory and the more we would be paying inbound freight to replenish our raw materials. Therefore, I would include inbound freight and labour costs in the COGS value in my inventory turn calculation. This leaves us with the following COGS for our inventory turns formula.

As an aside, if you’re the company owner and you’re sitting in a bank with your financial statements in hand and the banker wants to compare your inventory turns to other companies they serve, you will certainly want to use the COGS value from the financial statements. That way, you can avoid having to explain why you exclude some general ledger entries from your calculation, but for internal monitoring of your inventory performance, make your own logical choice on what to include in the COGS value for your inventory turns metric.
How to Calculate Inventory Cost
Let’s move on to see what value we put in the denominator of our equation for the inventory cost. There are two popular choices.
In some cases, the inventory value is the average cost of the inventory at the start of the year (if we’re calculating our metric annually) and the inventory cost at the end of the year. In other cases, people may choose to use the end of year inventory cost.

In the table shown, we see that we calculate the inventory cost for each item we carry by multiplying the [Units in Stock] by the [Unit Cost]. We then add up the inventory cost of all of our items to get the total cost of our inventory. Let’s use the cost on the screen as our end of year value and calculate our inventory turns for the year in question.
Inventory Turns = 614425 / 120813 = 5.1 turns
You may be wondering why I use accounting information for this formula instead of just cancelling out the cost per unit from the formula and calculating turns as [# unit sold] / [# units in stock]. That’s because the unit cost of an item can change throughout the year as pricing changes with your suppliers.
Inventory Turns for Finished Goods and Raw Materials
We can take the inventory turns metric one step further. If you’re a company that purchases raw materials and manufactures finished goods, you may wish to calculate inventory turns for your finished goods separately from the inventory turns of your raw materials. This gives you an idea of how well you’re managing each of these two categories of inventory.
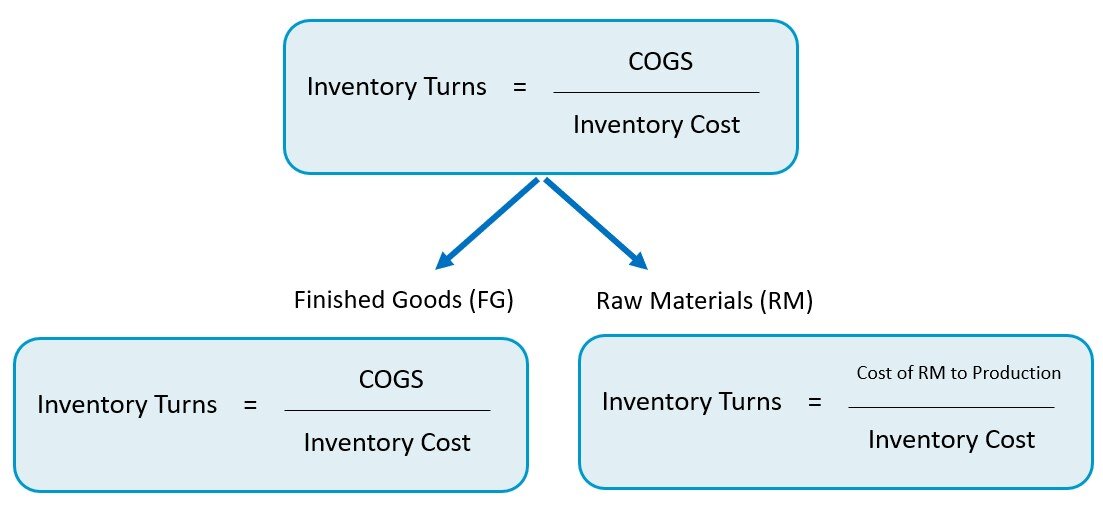
The inventory turns formula for finished goods is the same as the one we’ve used so far, namely, cost of goods sold divided by inventory cost.
For inventory turns of raw materials, we have to think a bit differently because we don’t SELL raw materials but if we remember that what we’re interested in measuring is the speed of movement of inventory, we essentially “sell” raw materials to the production floor. The equivalent formula to calculate inventory turns for raw materials would then be:
Inventory turns = [cost of raw materials used in production] / [Inventory Cost]
Like the previous inventory turns formula, the cost of inventory used can either the average value at the start and end of the time period being measured, or the ending value.
What is a Good Number of Turns per Year?
You now know exactly how to measure inventory turns but we need to learn how to interpret the numbers. What is a good number of turns in a year?
This value will vary by industry, so a good approach is to look up the financial records of public companies in your industry and use their financial statements to compare your inventory turns to theirs. You may also be able to locate a consolidated industry report. Keep in mind that what you read on the financial statements will include the additional general ledger accounts.
Weeks of Supply (WOS)
Now that you know the speed at which your inventory goes out the door, you are equipped to calculate other metrics such as weeks of supply (WOS) or days of supply.
Weeks of Supply (WOS) = on hand inventory / average weekly units sold
Summary
We have seen how to calculate inventory turns depending on the purpose for which the calculation is intended. For financial analysts, bankers and inventory management personnel, the calculation can be slightly different. Knowing the details behind the differences is crucial in properly aligning this metric to types of decisions you need to make.